This report displays:
- all appointments across the organisation.
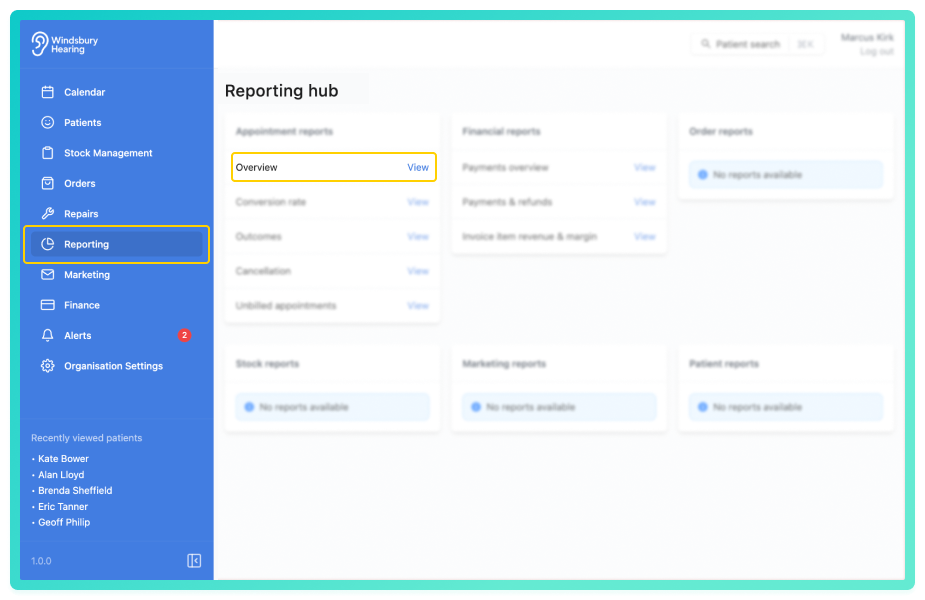
View the overview report
By default, the data will be shown in a single row, displaying the total number of appointments in the selected date range. A bart chart will also display this data visually.
This table consists of:
- Group - based on the grouping selected.
- Count - the total number of appointments for that group.
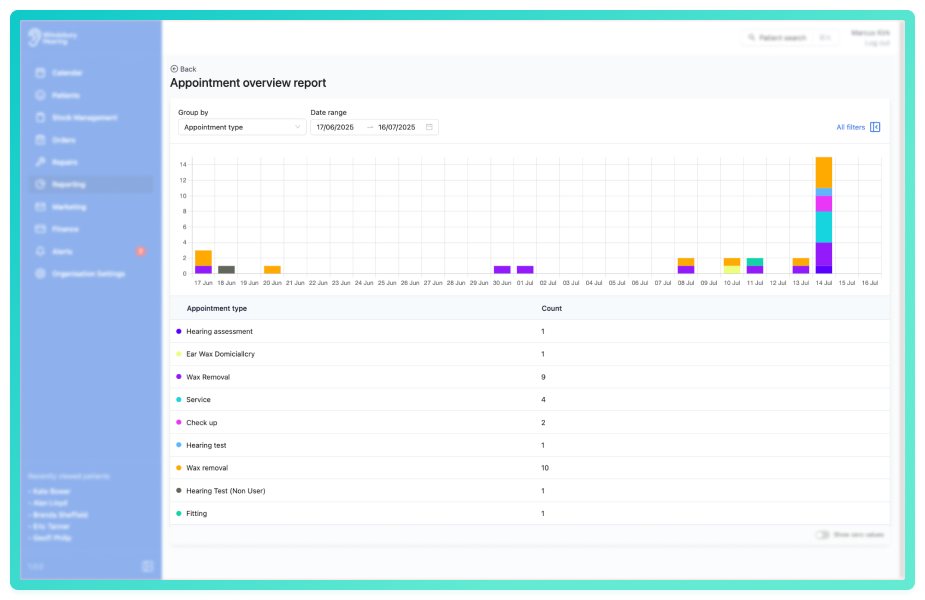
Use the Group by dropdown to segment the data.
Click All filters to open the sidebar and apply the filters to narrow the results.
You can save a set of filters for each report to quickly change the data on the report. See Saved report filters
The overview report is useful for seeing overall appointment volumes and understanding trends across teams, locations, and referral sources.
Was this article helpful?
That’s Great!
Thank you for your feedback
Sorry! We couldn't be helpful
Thank you for your feedback
Feedback sent
We appreciate your effort and will try to fix the article