The booking/creation report in HearLink helps your organisation analyse how and where appointments are being created. It provides both counts and percentages of bookings, allowing you to identify trends in appointment creation by clinic, appointment type, creator or referral source.
This report is particularly useful for understanding booking activity, staff performance, and referral effectiveness.
This report displays:
- total appointment opportunities.
- converted appointments and conversion rate.
- average order value.
- total revenue.
You can also group data and apply filters to refine your analysis.
View the conversion rates report
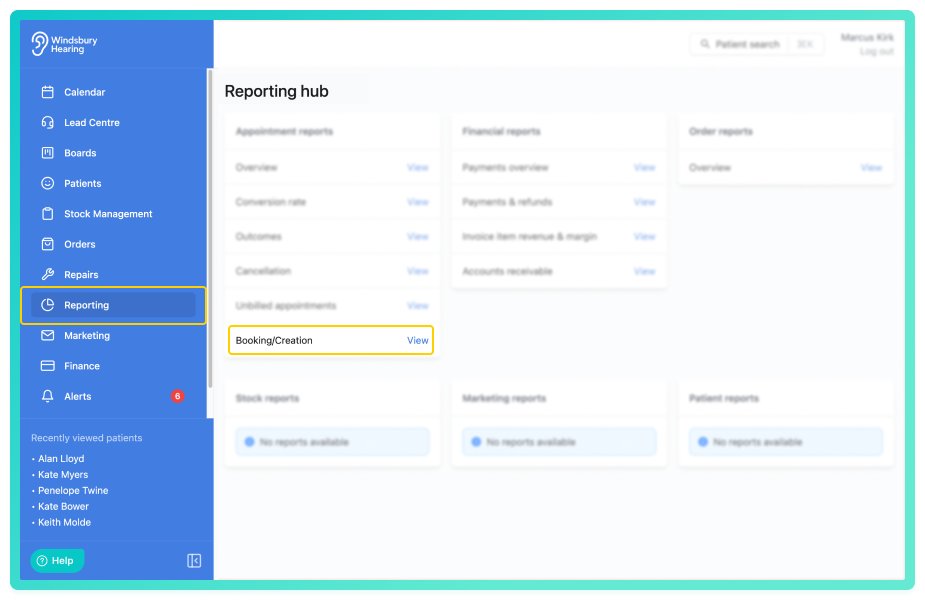
- Navigate to Reporting.
- Click the View text on the Booking/creation report of the Appointment reports.
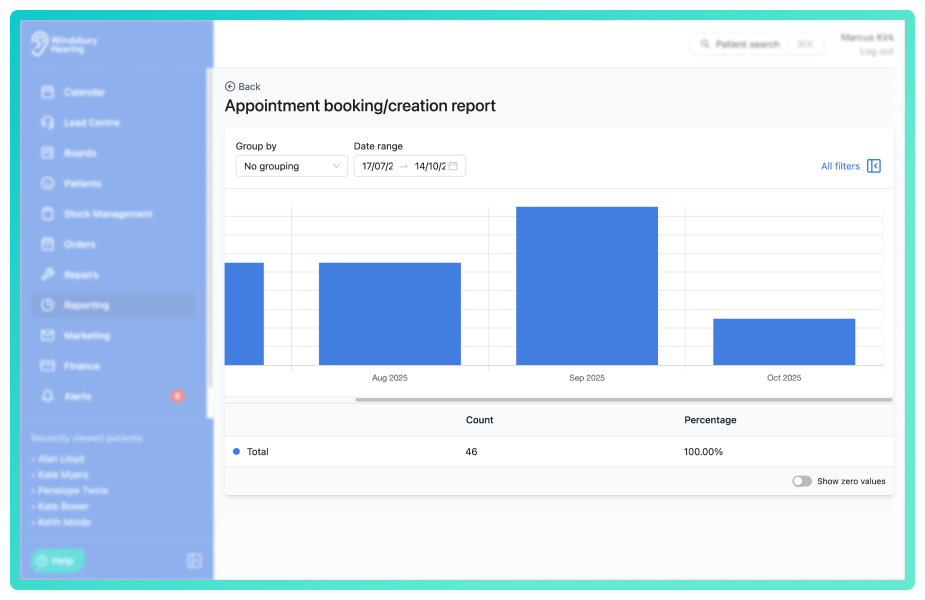
By default, the report shows a single total row of data across the selected date range
This includes:
- Count
- Percentage
You'll also see a bar chart visualising the conversion activity across the selected period.
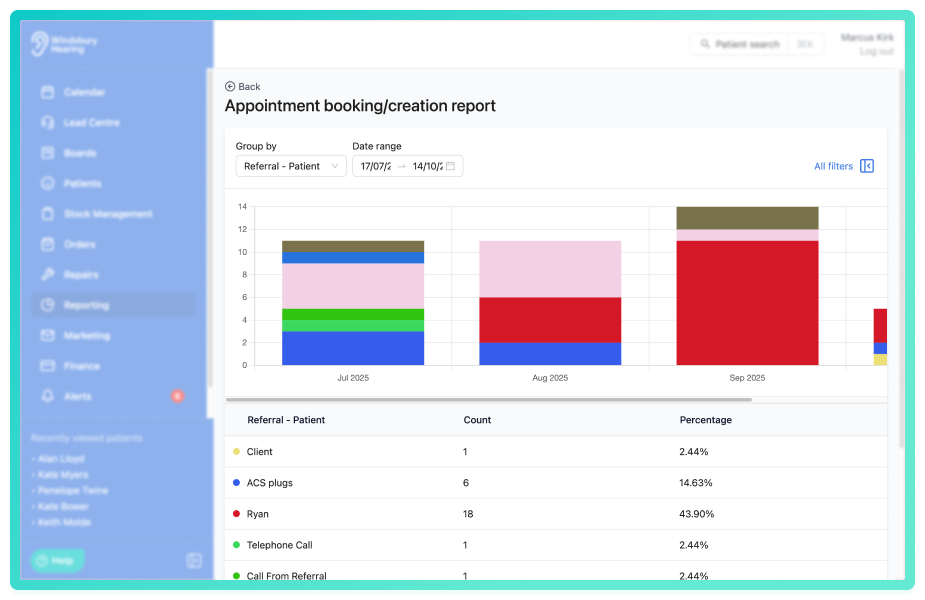
Group by
Use the Group by dropdown to segment the data.
Examples:
- No grouping - shows all creation data without grouping.
- Referral - understand where appointments are originating from.
- Creator - see which team members create the most bookings.
- Appointment type - compare how different appointment types are booked.
Grouping changes both the graph and the breakdown table below.
Click All filters to open the sidebar and apply the filters to narrow the results.
You can save a set of filters for each report to quickly change the data on the report. See Saved report filters
You can also enable:
- Show zero values - includes groupings with no data for fuller context.
Use this report regularly to monitor booking trends and ensure your workflow is aligned with referral and clinic performance.
Was this article helpful?
That’s Great!
Thank you for your feedback
Sorry! We couldn't be helpful
Thank you for your feedback
Feedback sent
We appreciate your effort and will try to fix the article