Track payments received across your organisation, segmented by type, source, or clinic.
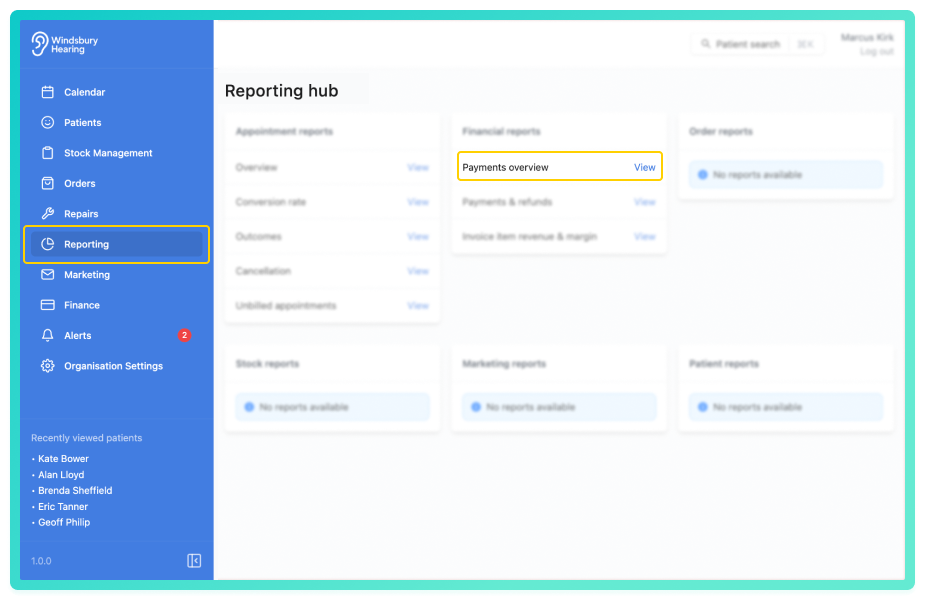
View payments report
The report displays a breakdown of payment counts and totals across the organisation. By default, it shows a single row summarising all payment activity with no grouping applied. You can choose to Group the data, as an example the image shows the data grouped by clinics.
A bar chart gives a visual representation of payment totals over time or by category.
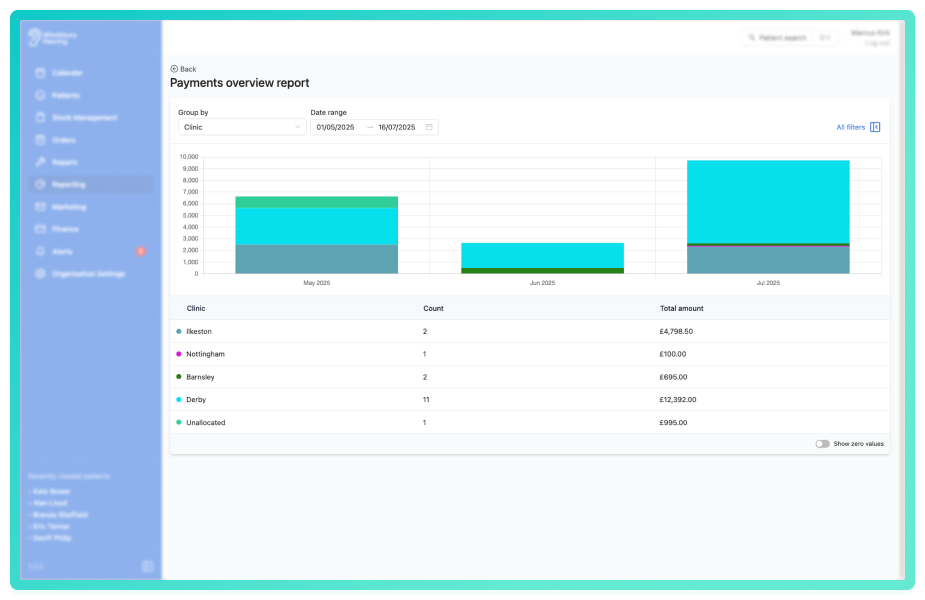
Use the Group by dropdown to segment the data.
Click All filters to open the sidebar and apply the filters to narrow the results for a more targeted view.
You can save a set of filters for each report to quickly change the data on the report. See Saved report filters
Enable Show zero values to include groupings that had no payments during the selected date range. This can help identify areas of low or missing activity.
Was this article helpful?
That’s Great!
Thank you for your feedback
Sorry! We couldn't be helpful
Thank you for your feedback
Feedback sent
We appreciate your effort and will try to fix the article